1R4 Academic Program Quality Results
What are the results for determining the quality of academic programs?
• Summary results of assessments (include tables and figures when possible)
• Comparison of results with internal targets and external benchmarks
• Interpretation of results and insights gained
 Summary Results of Assessments AND Comparison of Results with Internal Targets and External Benchmarks AND Interpretation of Results and Insights Gained Summary Results of Assessments AND Comparison of Results with Internal Targets and External Benchmarks AND Interpretation of Results and Insights Gained
Internal Program Review: Every program receives annual program performance data, including developing an overall program vitality measure (1R 3 ). These sheets indicate program quality in numerous areas, including enrollment, retention, graduate counts, employment rates, assessment results, and satisfaction levels of employers and students. Through the Annual Planning process, the data and vitality measures are reviewed by program faculty and the program’s Academic Administrator to determine program needs and set direction for program quality.
Internal Program Review Insights and Action Plan:
Because much of this information also indicates effective program design and program currency, these results are included in 1R 3 .
State Program Review: Annual state reviews are conducted on all Institute programs based on three established criteria: program enrollments, student retention (state defined fall to fall data), and graduate six-month placement results. Targets are set for each criteria and gradually increase each year. Programs not meeting a criteria may be requested to complete a program continuation form, indicating the steps that will be taken to improve performance. Programs not improving performance over a period of several years may go before the state Board for review and possible discontinuation.
State Program Review Insights and Action Plan:
Over the past five years, Southeast Tech has had four programs fall under an established criteria, resulting in a state report. However, all four programs have since met the established criteria. The process has proven to be beneficial in addressing potential concerns early so that the proper measures can be taken for continuation. All four of Southeast Tech’s programs have improved their performance and are meeting the established standards.
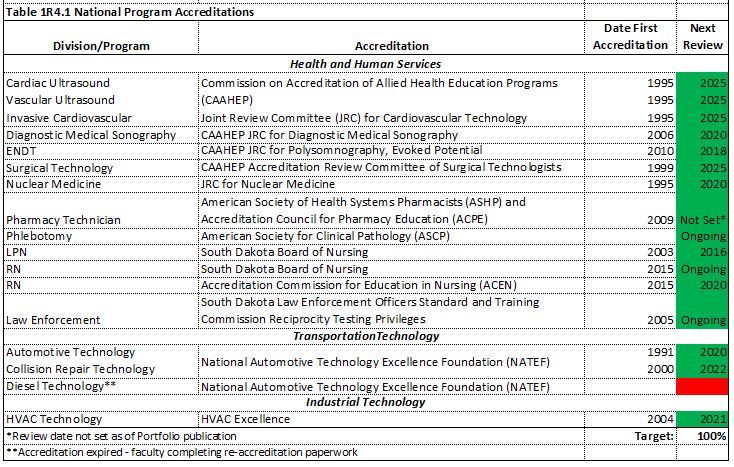
National Program Accreditations: Sixteen of Southeast Tech’s programs maintain national program accreditations through various accrediting bodies (Table 1R4.1). The Institute’s target is to maintain these accreditations at 100%.
National Program Accreditation Insights and Action Plan: 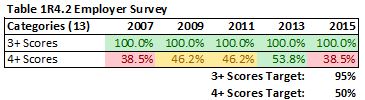
Currently, of the sixteen accredited programs, 93.8% (all but one) have continued their accreditation meeting all accrediting standards. The Institute’s Diesel Technology program has undergone recent full-time faculty turnover just prior to accreditation renewal; therefore, the Institute put the request for reaffirmation of accreditation off until the new faculty are ready. Each program uses the results of its individual accreditation visits to determine future action plans and improvements (1I 4 ).
Employer Survey: Southeast Tech’s Employer Survey, conducted every other year, requests employers to rate recent graduates (those graduating over the past two years) on specific skill sets in thirteen categories. (See 1R 1 for skill set results related to CLO attainment.) S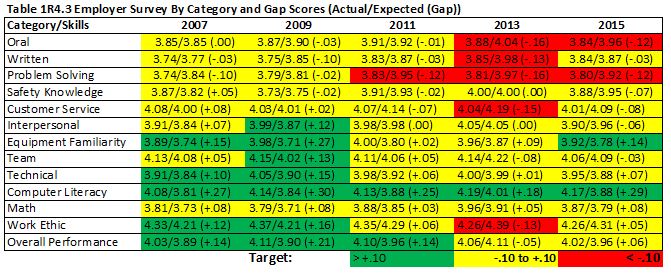 cores of “3+” indicate employers found the graduate skill levels for that skill set to be “Satisfactory” or above. Scores of “4+” indicate employers found these skills to be “Very Good” to “Excellent”. Table 1R4.2 provides an Institutional-level look at the percentage of average scores for all thirteen categories at the 3+ and 4+ ranges. Participation levels for the survey have been excellent, with recent response rates of 44% (2015), 33% (2013) and 42% (2011). The next survey results will be available summer 2017. cores of “3+” indicate employers found the graduate skill levels for that skill set to be “Satisfactory” or above. Scores of “4+” indicate employers found these skills to be “Very Good” to “Excellent”. Table 1R4.2 provides an Institutional-level look at the percentage of average scores for all thirteen categories at the 3+ and 4+ ranges. Participation levels for the survey have been excellent, with recent response rates of 44% (2015), 33% (2013) and 42% (2011). The next survey results will be available summer 2017.
Employer Survey Insights and Action Plan: As Table 1R4.2 indicates, at the Institutional level, 100% of the average scores for all thirteen categories combined met the 3+ range. These results have been consistent from 2007 to 2015, indicating that overall, graduates are meeting employer expectations. From 2007 to 2013, the percentage of Institutional score averages meeting the 4+ range increased from 38.5% to 53.8%. However, in 2015 the number of 4+ scores fell to 38.5% of ratings. To better understand the decrease, Southeast Tech also reviews gap scores (Table 1R4.3) between ratings of graduate actual skill level to employer expected skill ratings (Action - Expected = Gap). Overall, Southeast Tech graduates receive gap scores at meeting (yellow) or exceeding (green) employer expectations. However, two areas show a marked decrease in employer satisfaction: oral and problem-solving skills. The data also indicates that employer expectations in these two areas has increased; therefore, Southeast Tech will need to improve graduate performance in order to meet these higher standards. To meet this challenge, Southeast Tech has set these skills as focus areas for upcoming assessments (1P 1 ). In Spring 2016 Southeast Tech again conducted its Employer Survey. Results will be compiled and analyzed by the External Stakeholder Relationships Team and CLT in Summer 2017. In order to gain more insight into employer needs and satisfaction with Institute graduates, Southeast Tech held sector breakfasts in Spring 2017. Input from these sector breakfasts will be used by the External Stakeholder Relationships Team and Administrative Team to determine employer skill level needs and further enhance program quality.
Placement Rates: High graduate placement rates can be an indicator of program quality as these graduates are highly recruited by industry. Low graduate placement rates can indicate that a program’s quality is not meeting industry expectations. As a technical institute with a mission of educating for employment, graduate placement rates are vital to the Institute meeting its mission as well as determining program quality. General graduate employment provides proof of meeting the Institute’s mission. Employment in a related field provides an indirect measure of program quality.
Placement Rates Insights and Action Plan: As shown in Table 1R4.4, from 2012 to 2016, Southeast Tech has maintained graduate six-month placement rates between 95.9% and 98.0%, which has met the Institutional target every year. In related field employment placement rates have ranged from 88.7% to 93.9% with all measures but one meeting the target. Both data elements are indicators that the Institute is meeting its mission and providing high quality programs. Each program uses individual program data to develop program action plans as needed.
Add to Catalog Bookmarks (opens a new window)
|
