1R2 Program Learning Outcome Results
What are the results for determining if students possess the knowledge, skills, and abilities that are expected in programs?
• Outcomes/measures tracked and tools utilized
• Overall levels of deployment of assessment processes within the institution
• Summary results of assessments (include tables and figures when possible)
• Comparison of results with internal targets and external benchmarks
• Interpretation of assessment results and insights gained
Overall Levels of Deployment of Assessment Processes Within the Institution
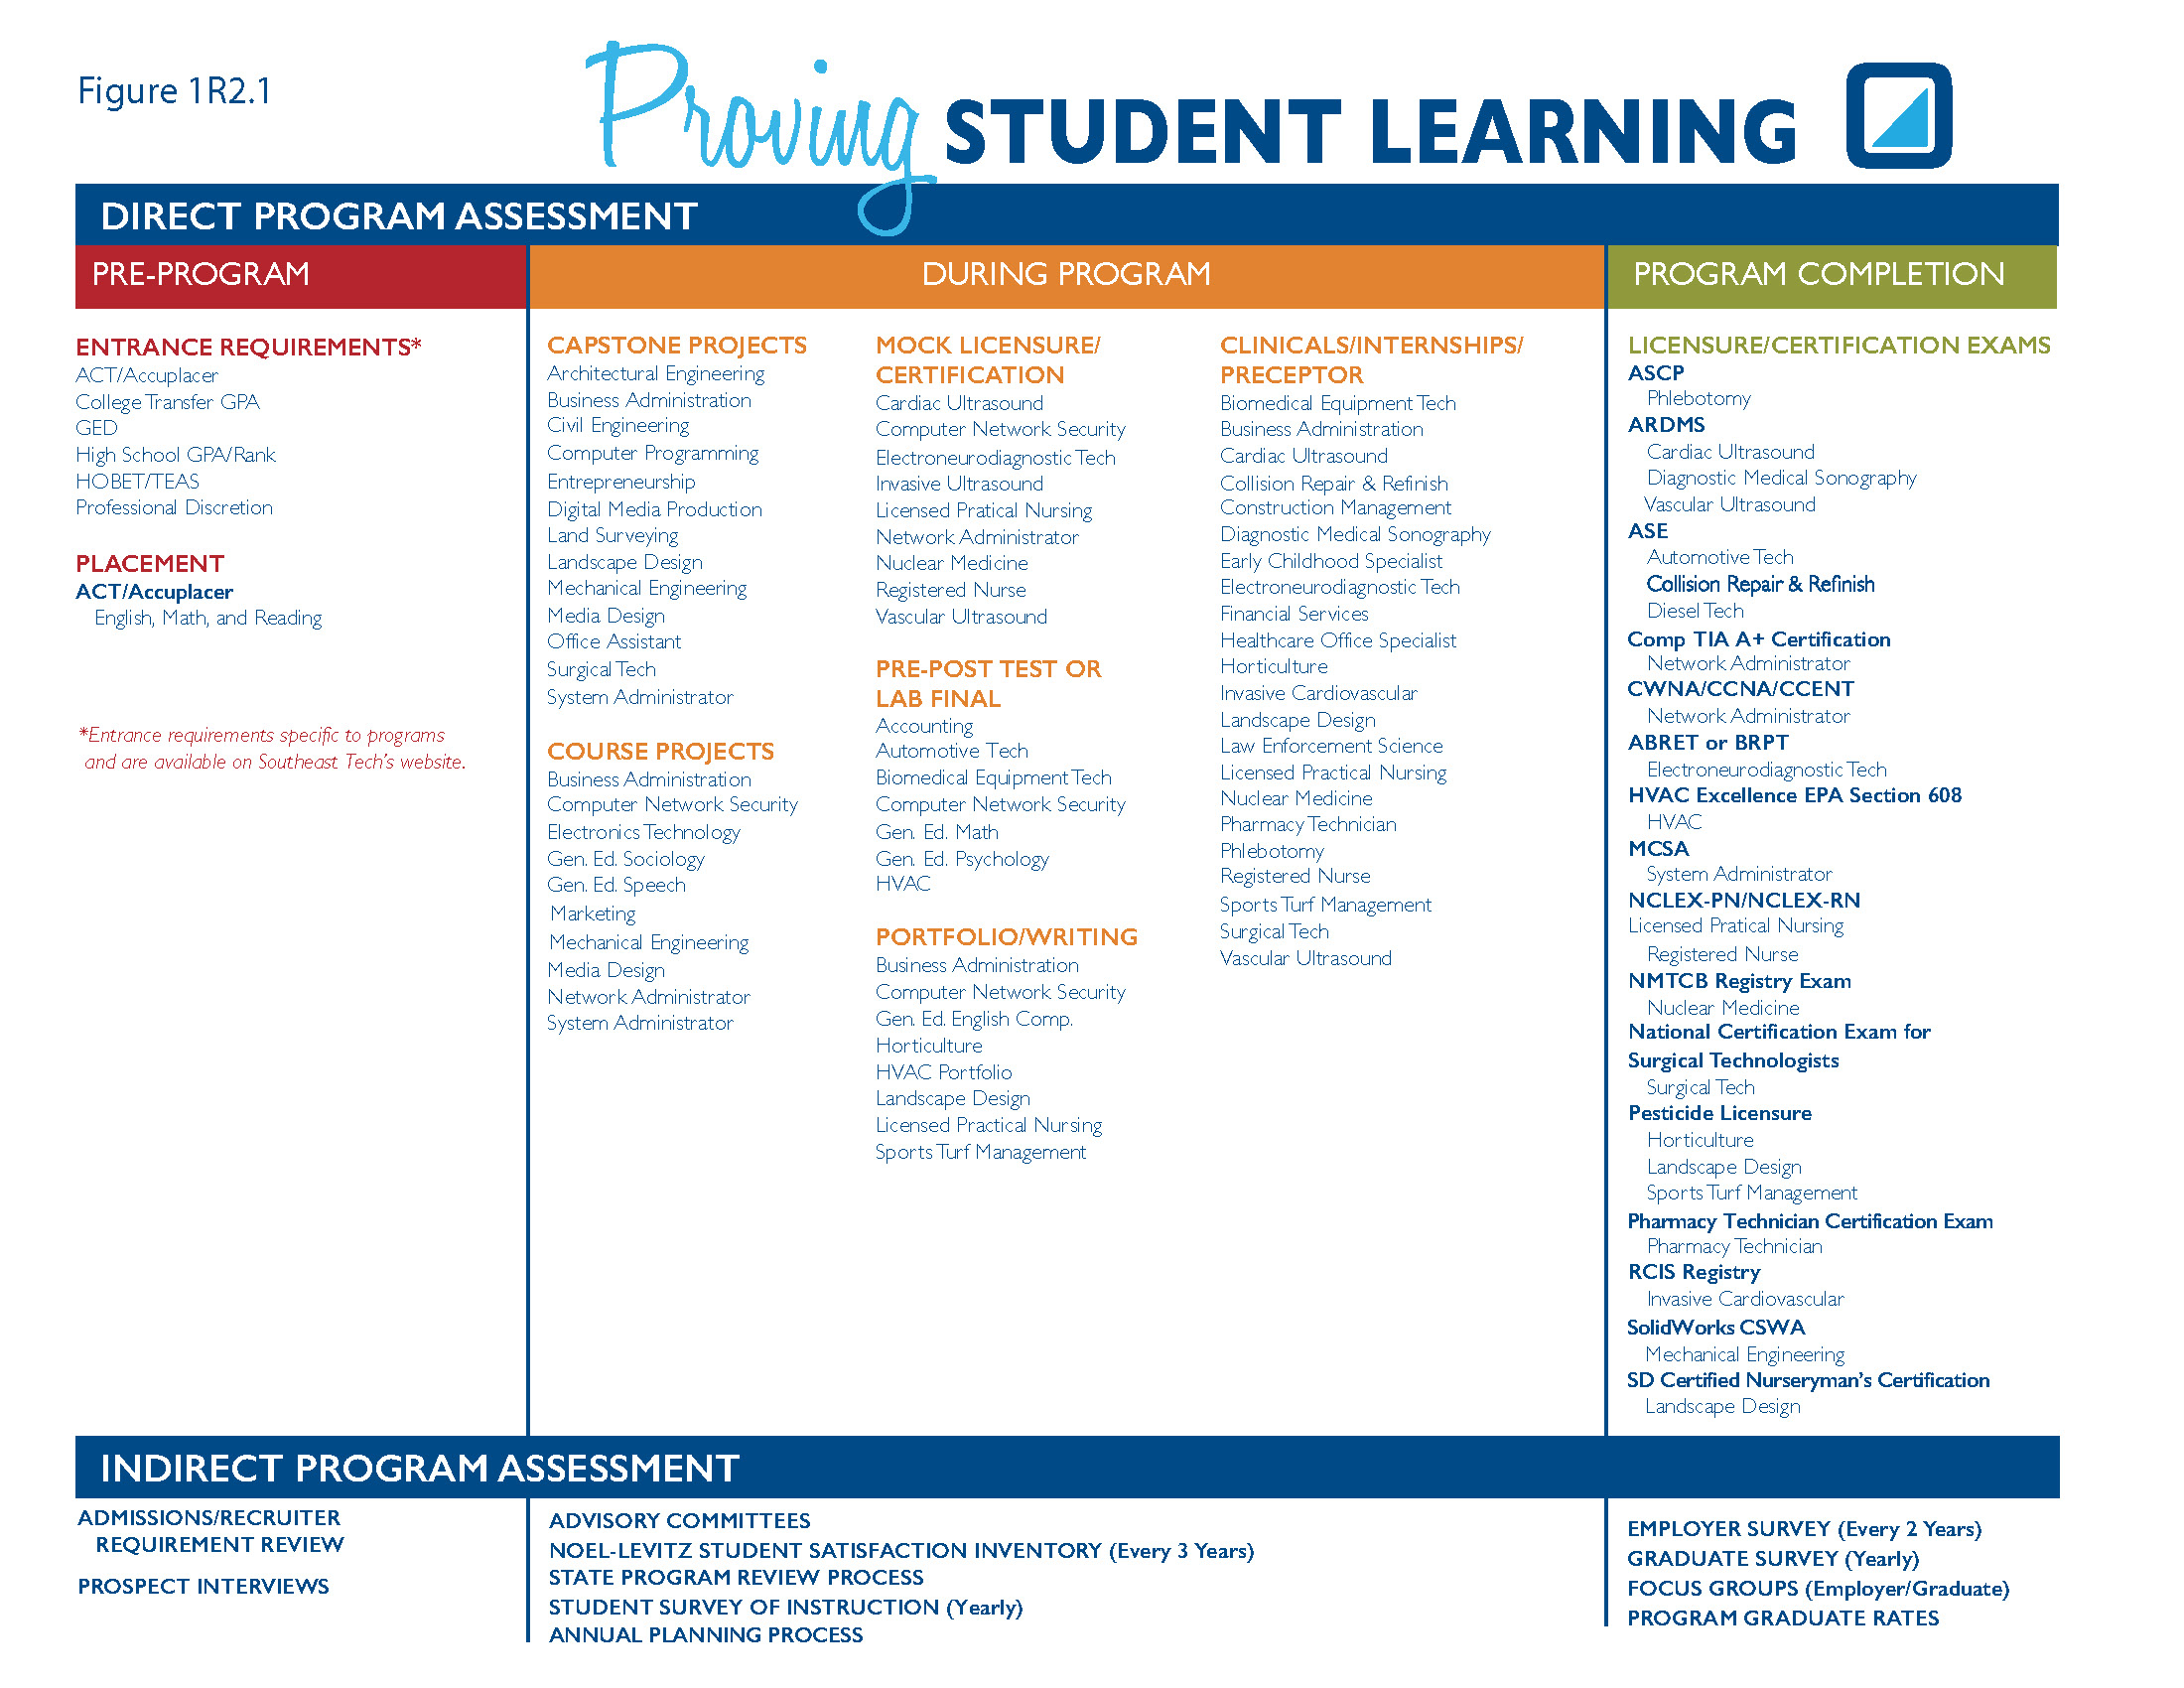
Southeast Tech has a long history of deploying program-level assessments dating back to the 1990s. The Institute uses direct assessments of student learning at the pre-program, program summative and program completion levels (Figure 1R2.1). The pre-program level provides the Institute with entry-student program readiness (entrance requirements) and placement results (English, math and reading). While not used for program level assessment, proper entrance and placement requirements help the Institute assure program level outcomes are achieved.
Program-level assessment is accomplished at the Summative and Program Completion levels. As shown in Figure 1R2.1, all Southeast Tech programs establish specific program-level assessments with some programs conducting more than one.
It is Southeast Tech’s goal that programs conduct their assessments on an annual basis; however, due to major changes in program curriculum, faculty, or other factors, not every program is able to conduct their assessment every year.
To assure that assessments are completed on a regular basis, Southeast Tech’s target is for 100% of programs to complete a program assessment a minimum of once every three years and 90% a minimum of once every two years. Table 1R2.1 provides the percentage of programs meeting these two targets.
While Southeast Tech has met the “During 3 Year” target in 2011 and 2012, and the “During 2 Year” target in 2010-2013, overall participation in program assessment has fallen to within 90% of target for both 2014 and 2015. This is partly due to the addition of new programming and new faculty who are currently working to develop program-level assessments. However, some of the discrepancy is also due to programs not completing or not documenting their assessments.
Programs not meeting the participation targets are assisted by the Celebrating Learning Team to get the program’s assessments back on track. The Institute recognizes that new programs and new faculty are in need of additional training and assistance; therefore, the Institute has included this area for future improvements (1I 2 ).
Summary Results of Assessments AND Comparison of Results with Internal Targets and External Benchmarks, AND Insights Gained
Program Level Assessment: Each program analyzes its own specific program assessment in order to determine if its target level is being met. While it is not possible to show each program’s results within the portfolio, Table 1R2.2 provides the percentage of programs meeting their program-specific targets (green) as well as the percentage within 90% of target (yellow) and the percentage below 90% of target (red).
2010-2016 Analysis and Insights: While the initial reaction to only 66% (year 2015-2016) of programs meeting their assessment targets might be negative, a review of these targets indicates that programs have set significantly high expectations. These expectations not only challenge the students, it challenges the program to determine ways to meet the assessment expectations. While it would be easier to set lower targets that can be easily obtained, setting stretch targets has led the Institute to more significant improvements at the program level  (1I 2 ). (1I 2 ).
Licensures and Certifications: Twenty Southeast Tech programs are associated with one or more state or national licensures/certifications, which provide the Institute with an additional assessment of student learning at the program level, and in many cases the opportunity for national benchmarking. As Table 1R2.3 shows, Southeast Tech students regularly perform above the national average, meeting the Institutional target.
2010-2016 Analysis and Insights: Southeast Tech is pleased with the certification results, which are consistently above national pass rates. No Institute actions are planned; however, individual programs review results and set actions accordingly.
Employer Survey: Employer survey results are provided in 1R 4 as indicators of program quality; however, these results are also indicators of meeting program learning outcomes. Each program receives disaggregated data from the employer survey, which can then be used as an indirect measure of program assessment in thirteen areas: oral and written communication, customer service, interpersonal, problem solving, equipment familiarity, team, technical, safety, computer literacy, math and work ethic skills as well as overall performance.
Analysis and Insights: While providing individual program employer survey data within this portfolio is not possible, Southeast Tech graduates receive high praise from employers in almost every survey category regardless of program, generally meeting or outperforming employer expectations. In relation to program learning outcomes, the 1R4 Table 1R4.2 indicates the percentage of programs with scores in the specific survey categories that average at the 3+ and 4+ ranking on a five point rating scale. Table 1R4.3 provides evidence that a positive difference between actual and expected performance exists for the majority of the categories. Programs each use disaggregated data to develop action plans to better meet employer survey needs. Southeast Tech is currently collecting and analyzing the results of its 2017 Employer Survey, which will be completed Summer 2017.
Employment Rates: As a technical institute with a mission of educating for employment, graduate employment rates provide an additional indirect measure of student program outcome achievement. Employment rates are also indicators of program quality; therefore, employment rates are provided in 1R 4 .
Analysis and Insights: A review of the Institute’s six-month graduate employment rates, which have been consistently at 90+% for employment and at 89+% for employment in field/related field, provides a strong indirect measure that the Institute is meeting its mission.
Add to Catalog Bookmarks (opens a new window)
|