2R1 Current and Prospective Student Need Results
What are the results for determining if current and prospective students’ needs are being met?
• Summary results of measures (include tables and figures when possible)
• Comparison of results with internal targets and external benchmarks
• Interpretation of results and insights gained
Summary Results of Measures with Internal Targets and Insights Gained
 Note: A year of “2015” in the tables indicates the fall 2015 cohort group. Fall 2016 cohort retention data will not be available until Fall 2107. Retention rates not yet available are marked with an “NA”. Note: A year of “2015” in the tables indicates the fall 2015 cohort group. Fall 2016 cohort retention data will not be available until Fall 2107. Retention rates not yet available are marked with an “NA”.
First Time Students:
From 21% to over 24% of the Institute’s student population is composed of first time students (Table 2R1.1). Therefore, the Institute recognizes the significance of this key student group. Prior to 2012, retention rates for First Time students held consistently around the 52-55% range. In 2009, based on previous year data and the desire to improve overall Institute retention rates, Southeast Tech implemented a Student Success Center, including three Student Success Advisors and a Student Success Seminar course. The Institute believes this change, along with the implementation of the overall retention process described in 2P 1 , has helped increase First Time student retention by 4-8%, with the past three years above 60% (Table 1R1.2). While still below the 68% target, the Institute is pleased with the movement toward the target.
First Time Students Summer 2016 Insights and Action Plan (4.C.3):
- Increase use of Southeast Tech Cares First Time Student predictive modeling data to determine focus areas for action;
- Pilot a “Lunch with an Advisor” in the new building’s common’s area to increase exposure and immediate response to student needs;
- Review Student Success Seminar curriculum and assure most meaningful information is introduced early to reduce early attrition;
- Increase use of Career Assessment software to assure correct student program placement, including offering the assessment during high school visitation days, high school visits, and college fairs;
- Hold a career exploration day for high school and 8th grade students, including the Career Assessment Inventory;
- Include the Career Assessment Inventory as part of the admissions process.
New Transfer Students
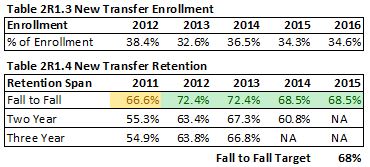 Contrary to most two-year colleges, Southeast Tech’s transfer-in population is significant, making up 35% to over 38% of the student population (Table 2R1.3). Believing that transfer-in students with 9+ credits of successful post-secondary experience would not need to take the Student Success Seminar course, the Institute waived the requirement for these students. However, as the Success Center staff worked with these students, it became apparent that this student group still needed assistance in navigating Southeast Tech’s processes and procedures. Additionally, the Student Success Advisors’ workloads with seminar course students did not allow them the opportunity to provide these services to the desired level. Therefore, in 2013, Southeast Tech revised its Librarian position to be a transfer-in Student Success Advisor/Librarian with the goal of providing full Success Advisor services to these students. Overall retention of transfer students has remained strong and above the target level for the past four years (Table 2R1.4). Contrary to most two-year colleges, Southeast Tech’s transfer-in population is significant, making up 35% to over 38% of the student population (Table 2R1.3). Believing that transfer-in students with 9+ credits of successful post-secondary experience would not need to take the Student Success Seminar course, the Institute waived the requirement for these students. However, as the Success Center staff worked with these students, it became apparent that this student group still needed assistance in navigating Southeast Tech’s processes and procedures. Additionally, the Student Success Advisors’ workloads with seminar course students did not allow them the opportunity to provide these services to the desired level. Therefore, in 2013, Southeast Tech revised its Librarian position to be a transfer-in Student Success Advisor/Librarian with the goal of providing full Success Advisor services to these students. Overall retention of transfer students has remained strong and above the target level for the past four years (Table 2R1.4).
New Transfer Students Summer 2016 Insights and Action Plan (4.C.3):
- Increase awareness across campus that we have a specific Student Success Advisor (SSA) assigned to transfer students;
- Develop a “course” on STInet that provides transfer students information similar to the Student Success Seminar class or offer a condensed Seminar course;
- Add transfer SSA contact information to the transfer website page for better connection prior to and after student enrollment;
- Develop transfer advising registration sessions;
- Implement use of social media, such as twitter, for additional transfer student connection;
- Create a JumpStart just for transfer students;
- Assure evaluations of transcripts are done in a timely manner and places transfer students effectively;
- Work with Jenzabar to create a predictive model for Transfer students (2018-2019);
- Review requirements to be removed from the Student Success Seminar course (currently requires 9 successful post-secondary credits) to include a GPA requirement as well (2016-2017 review, 2017-2018 implement).
Low Income Students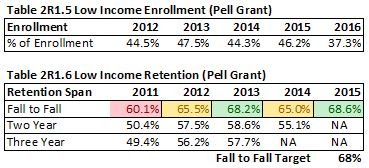
Another significant enrollment group is low-income (Pell-eligible) students, which has made up to 47.5% of Southeast Tech’s student population (Table 2R1.5). When Southeast Tech first introduced its Success Center, working with this key student group was one of the primary purposes. The Institute believed that helping these students navigate the financial aid world as well as assisting them in meeting immediate and long term financial needs was key. Therefore, the seminar course focuses lessons specifically on student personal finances, financial aid, and part-time job opportunities. The Institute also implemented an Emergency Loan process in 2009 to support students with immediate financial needs up to $500. The Institute believes these efforts have helped improve retention, with the Institute reaching its target level for the first time for the 2013 cohort and again for 2015 (Table 2R1.6).
Low Income Students Summer 2016 Insights and Action Plan (4.C.3):
- Continue education on financial aid and finances through the Seminar course, New Transfer Student “course” site, and Academic Recovery class;
- Input emergency loans in Cares so students can be tracked and offered additional help;
- Review Academic Recovery student population to see if any key student groups make up significant percentages of the population and plan coursework accordingly;
- Look for opportunities to develop low income student scholarships during the second year of their programs;
- Create a liaison/advisor for low-income students (2017-2018);
- Further identify and disseminate information on other financial resources including emergency loans, and Sponsor a Scholar;
- Develop a process for students to donate their textbooks to future students.
Students of Diverse Ethnicity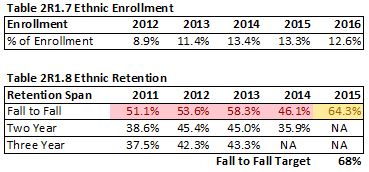
In recent years, Southeast Tech has experienced a significant increase in its ethnic student population (Table 2R1.7), which has grown from 7% of the student population in 2010 to 12.6% in 2016. This increase has placed the overall ethnic student retention rate, which has been consistently below the Institute’s target, on the Institute’s radar for improvement. Therefore, in Fall 2015 the Institute established an AQIP Action Project to address ethnic diversity concerns and is working toward implementation over a four-year period (2015-2019). While the 2015 cohort has seen a significant increase in retention, reaching a level of 64.3% as compared to previous years of 58.3% or lower, the Institute is working to assure these gains are sustained and continue to improve (Table 2R1.8). Additionally, the Sioux Falls Tomorrow Vision for the Future 2014 report from the community planning group adopted a long-range goal of the Sioux Falls Cultural Plan to address the needs of the community’s diverse population.
Students of Diverse Ethnicity Summer 2016 Insights and Action Plan (4.C.3):
- Create a student ethnicity club;
- Develop a partnership with the Sioux Falls Multicultural Center and develop support services;
- Assure students are placed correctly during the admission process;
- Implement a reading course with required placement according to Accuplacer reading scores;
- Monitor effectiveness of those placed in the reading course;
- Review current AQIP project on ethnicity to determine where the Institute is at;
- Require faculty to enter Care referrals immediately when language becomes a barrier and offer these students assistance through the one credit Success Lab;
- Create a liaison/advisor for ESL/ELL students or create for a broader ethnicity group (2017-2018);
- Hire more ethnically diverse employees;
- Research how other colleges are working with ethnic groups and ESL/ELL students;
- Connect with the Hovland Adult Learning Center to determine how ESL/ELL support can be provided;
- Assure ethnicity is included in marketing.
Online Students (Distance Learners)
Another significant key student group with fast growing enrollments is the Institute’s online student population. Moving 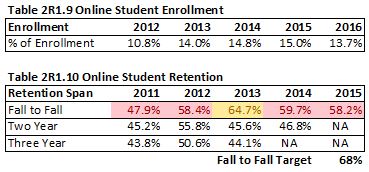 from 3.7% of student population in 2010 to 13.7% in 2016, online students make up the fastest growing key student group for the Institute (Table 2R1.9). Online student retention rates ranged from 47.9% to 58.2% from 2010 to 2015. In order to improve these rates, the Institute recognized the need to provide these students with additional support, both for online technology troubleshooting and online course assistance. In 2012 Southeast Tech added online tutoring options, and in Fall 2013 the Institute hired an Online Support Specialist to provide online student assistance. While still early in its implementation, the Institute has seen retention rates reach 64.7% in 2013, placing it within 90% of the established target. In recent years, however, retention has fallen to 58-59%, indicating there is still more work to be done (Table 2R1.10). from 3.7% of student population in 2010 to 13.7% in 2016, online students make up the fastest growing key student group for the Institute (Table 2R1.9). Online student retention rates ranged from 47.9% to 58.2% from 2010 to 2015. In order to improve these rates, the Institute recognized the need to provide these students with additional support, both for online technology troubleshooting and online course assistance. In 2012 Southeast Tech added online tutoring options, and in Fall 2013 the Institute hired an Online Support Specialist to provide online student assistance. While still early in its implementation, the Institute has seen retention rates reach 64.7% in 2013, placing it within 90% of the established target. In recent years, however, retention has fallen to 58-59%, indicating there is still more work to be done (Table 2R1.10).
Online Students Summer 2016 Insights and Action Plan (4.C.3):
- Assure that online requirements are met during admissions, even for those taking a single online course;
- Provide more communication and build student knowledge on what it takes to meet online requirements;
- Form a committee to develop more online student support including an on-campus online/hybrid lab that allows individuals to come on campus to get help for their online course;
- Implement the REMIND.com application or similar options to assist online students;
- Require an online readiness course;
- Review and determine how to use TechSmith and Relay connection effectively.
Non-Traditional Students (Age and Gender)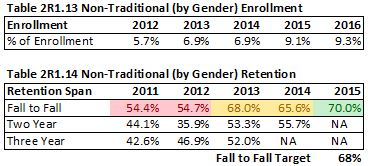 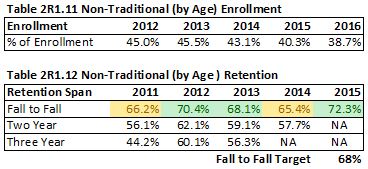
Non-traditional students, both by age (21+) and by gender (students in programs where less than 25% of the workforce are of that gender) have always been key student groups. Southeast Tech has consistently had from slightly below 40% to 45% of its population aged twenty-one or over (Table 4R1.11). These groups have also had consistent retention rates that rank at or very close to the established annual target (Table 2R1.12). By using Student Success Advisors, the seminar course, and the retention process described in 2P 1 , the Institute believes it is already directly impacting this non-traditional group. The most recent cohort group results (72.3%) met the Institute’s target of 68%.
Non-traditional students by gender have been a more challenging group in terms of student retention; however, the Institute is pleased with the recent improvements it has made in assisting these students and improving their retention. For the 2013 and 2014 cohorts, the Institute had two consecutive years of retention rates at or within 90% of the target, and the 2015 cohort results (70%) met the Institute’s target. The Institute believes its monthly Student Success Advisor interaction reports with this non-traditional group has helped place a direct focus on their success and has played a role in helping to achieve this improvement. Additionally, Southeast Tech has seen an increase in this student population from 5.7% in 2012 to 9.3% in 2016 (Table 2R1.13). Southeast Tech believes this increase is partially due to the Institute’s focus on increasing non-traditional-by-gender enrollments through scholarship opportunities.
Non-Traditional Students Summer 2016 Insights and Action Plan (4.C.3):
- Develop a mentoring opportunity so non-traditional students can connect with non-traditional industry professionals (age and/or gender) (2017-2018);
- Use the career assessment to assure proper placement;
- Create a non-traditional student club;
- Promote programs to non-traditional gender groups and recruit women for STEM programs.
Pre-Academic Students
Academically underprepared students (based on ACT or Accuplacer scores) entering Southeast Tech are required to take developmental courses in English, math and/or reading. As Table 2R1.15 indicates, the percentage of the student population needing these pre-academic courses had remained fairly consistent through 2014. The rise from 5.2% in 2014 to 20.2% in 2016 is due to Institutional placement adjustments requiring more students to take pre-academic coursework in order to better meet student needs and increase academic course success rates. What has been significant for the Institute is the increase in this key student group’s retention rates from an average of 52.8% for years 2011 and 2012 to 69.8% (above target) for 2013 and 61.7% and 62.5% (within 90% of target) for 2014 and 2015, respectively. The Institute believes this significant increase is directly related to the Institute’s move to its co-requisite courses in both English and math. In 2012, the Institute developed 099 labs to be taken in conjunction with the required ENGL 101 and MATH 101 academic courses. The 099 labs provide students with additional assistance on academic coursework, helping students achieve success and remain on target for program completion.
Pre-Academic Students Summer 2016 Insights and Action Plan (4.C.3):
- Continue pairing of 099/101 combination and review for further improvements;
- Review the use of an online 099 course and its effectiveness;
- Improve awareness of tutoring services for students in 099;
- Assure face-to-face options are available during all semesters.
Veteran Students
Southeast Tech has been a Military Friendly School for many years with a consistent veteran population (Table 2R1.17); however, the Institute has recently committed more time and effort to provide additional services and attention to the needs of our veteran students, including the development of a Veterans Club, more recognition opportunities at graduation and other events, scholarship fundraisers, increased awareness of veteran benefits, etc. Over the past few years, veteran retention rates have been above or within 90% of the Institute’s target; however, the most recent year fell below 60% (Table 2R1.18). While the Institute has not found a specific reason for the decrease in veteran retention, the Institute has developed the following actions to increase veteran retention to previous levels:
Veteran Students Summer 2016 Insights and Action Plan (4.C.3):
- Develop more veteran scholarships and continue to grow the amounts of the scholarships;
- Continue to develop ways to recognize veterans - such as a military Bookstore discount;
- Connect veterans to Southeast Tech employees who are also veterans or are currently in the military;
- Train more individuals on veteran services for back-up and additional support;
- Communicate and publicize information on military benefits, Veterans Club, available resources, etc.
Tutoring Students
Southeast Tech has provided free peer tutoring services since the 1980s and has always believed these tutoring services have been 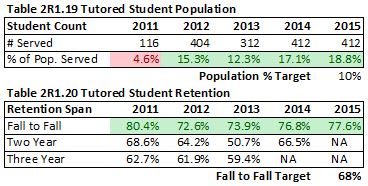 helpful for students, as indicated by the high retention rates ranging from 70% to 80% (Table 2R1.20). However, in reviewing the population served by tutoring in 2011, the Institute determined that a larger student population would benefit from tutoring services. Therefore, in 2011 the Institute set a target of serving a minimum of 10% of the student population with tutoring services. In addition, the Institute wanted to assure that it was providing online students with tutoring opportunities. To meet the 10% target, the Institute added online tutoring (2012), increased the subject matter covered by online tutoring, revised the location and focus of the tutoring center, increased communications on tutoring services, and developed stronger relationships with faculty. The result has been an increase of approximately 13% in population served (Table 2R1.19), while the overall retention rates have remained strong and well above the Institute’s target (Table 2R1.20). helpful for students, as indicated by the high retention rates ranging from 70% to 80% (Table 2R1.20). However, in reviewing the population served by tutoring in 2011, the Institute determined that a larger student population would benefit from tutoring services. Therefore, in 2011 the Institute set a target of serving a minimum of 10% of the student population with tutoring services. In addition, the Institute wanted to assure that it was providing online students with tutoring opportunities. To meet the 10% target, the Institute added online tutoring (2012), increased the subject matter covered by online tutoring, revised the location and focus of the tutoring center, increased communications on tutoring services, and developed stronger relationships with faculty. The result has been an increase of approximately 13% in population served (Table 2R1.19), while the overall retention rates have remained strong and well above the Institute’s target (Table 2R1.20).
Tutoring Students Summer 2016 Insights and Action Plan (4.C.3):
- Make using tutoring services a classroom assignment - maybe in SSS 100 or SSS 095;
- Increase classroom demos of online tutoring where the service can be most effective - possibly all ENGL 101 classes;
- Celebrate and communicate tutoring success rates to employees and students - syllabi, visits, orientations, JumpStart, emails, posters, etc.;
- Develop tutoring outreach by creating tutoring times in other buildings, especially in the new food court area;
- Increase the number of online tutoring hours students can receive before needing to request more;
- Develop a Writing Lab;
- Develop tutoring directly related to challenging assignments and/or tests;
- Discuss the current location of tutoring and if it should be moved (2017-2018);
Disability Students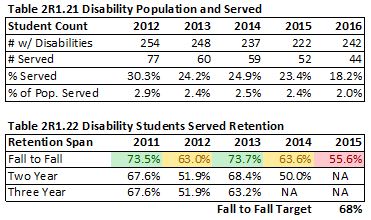
Approximately 250 self-reported Southeast Tech students indicate they have some type of disability. Southeast Tech directly serves between 24% and 38% of this population on an annual basis, which equates to about 2.4% to 3.0% of the Institute’s overall student population (Table 2R1.21). Unlike tutoring where Southeast Tech set a goal of increasing the percentage of population receiving tutoring services, the Institute has specifically determined not to establish a similar goal for disability services. The Institute made this decision because many students with disabilities do not want their particular disability to be viewed as a limitation for them in their program; therefore, the Institute respects their decision for privacy by offering and encouraging services, but protecting the student’s right to make that decision.
The retention number for those using these services, however, has been very high, with the past four years at or within 90% of the established target. That has not been true for the most recent retention rate for the 2015 cohort, which fell below 90% of target at a rate of 55.6% (Table 2R1.22). Southeast Tech is currently reviewing the reasons for the retention decrease and will set a plan of action in summer 2017 once the review is completed.
Disability Students Summer 2016 Insights and Action Plan (4.C.3):
No new actions at this time.
Housing Students
Southeast Tech provides on-campus housing for up to 202 students. Because we are a two-year technical institute, it is not surprising that the percentage of new housing students falls within the range of 48% to over 60% with fluctuations moving up and then down according to the number of students choosing to return to housing for their second (or in some cases third) year (Table 2R1.23). While overall retention has been within 90% of the target in previous years, the last three years (2013, 2014 and 2015) have had a significant overall increase, rising as high as 8% above the target level. The Institute is pleased with these results and believes it is due to several changes made prior to the fall 2013 semester including: 1. increasing housing staff from 3 to 4 positions (moved Housing Director off campus, created two Housing/Retention Coordinators, and continued to provide evening security services); 2. increased programming (door decorations, birthday signs, housing events); 3. connected SGA to housing for after-hour events; 4. remodeled floors to include hall study rooms; and 5. moved to a fob rather than key card entry system. The Institute believes these changes have helped housing students become better connected with the Institute as well as perform better academically.
Housing Students Summer 2016 Insights and Action Plan (4.C.3):
- Review contract terms for those leaving housing and determine if any changes are warranted;
- Review and revise the Housing Handbook room change policy to make the process more efficient;
- Discuss increasing on-campus housing;
- Discuss the creation of a housing curriculum with specific learning outcomes related to Southeast Tech’s Common Learning Outcomes.
Academic Recovery Students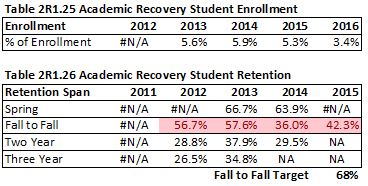
Southeast Tech’s Academic Recovery course offers students on financial aid/academic warning the opportunity to learn skills on how to improve academic performance and get back on track toward successful completion of their program. The course is still fairly new, so the impact of the course is still being evaluated. Currently, fall student Academic Recovery enrollments have been running at 5% to 6% of the student population. The decrease in the percentage in 2016 may be due to fewer students needing the course, a sign that other Institutional actions to improve student academic success are working. However, more information is being analyzed to determine why the decrease has occurred (Table 2R1.25). Not surprisingly, retention rates for these students is much lower than that of other key student groups (Table 2R1.26). Improving these rates and getting them closer to the target level is a major emphasis of the Retention Coordinators.
Academic Recovery Students Summer 2016 Insights and Action Plan (4.C.3):
- Consider requiring the Academic Success lab in the semester after completing the Recovery course to provide additional assistance and support;
- Review the curriculum and revise as necessary;
- Follow-up with Academic Recovery students once they return for the next semester to assure their continued needs are being met.
Comparison Results with External Benchmarks and Insights Gained
Since Southeast Tech has defined its own method for developing cohorts for key student groups, finding comparisons to other institutions is difficult. However, through the use of the National Community College Benchmarking Project (NCCBP), Southeast Tech has established benchmark opportunities for developmental academic and online (distance learning) students. The Institute will continue to pursue other opportunities for further benchmarking with other groups. Target levels are set by the Student Success Team and are designed to be stretch goals that are attainable and sustainable. Note: NCCBP data lags behind the current year in order to provide students the opportunity to take the developmental and required academic coursework.
Developmental Academic Students:
As stated earlier, Southeast Tech launched its co-requisite pre-academic/academic coursework (ENGL 099/101 and MATH 099/101) in 2012. This initiative was developed based on the Institute’s previously low success rate in developmental coursework. The improved success rate for these students has been significant, as indicated in the NCCBP comparison to other community colleges.
As Table 2R1.27 indicates, the Institute’s success rate for developmental math has increased from 58.1% in 2009 to 77.0% in 2013, moving the Institute from the 57th percentile to the 96th percentile. For Developmental Writing, the change has been just as dramatic, moving the Institute from a 56.9% success rate to a 77.4% rate, a change from the 17th percentile to the 90th percentile (Table 2R1.28).
Of course, the ultimate goal of any pre-academic course is to prepare students for the required academic courses. Therefore, it is important to track success  rates of developmental students in their required academic courses as well. rates of developmental students in their required academic courses as well.
However, this statistic has been more complicated to measure, and the initial results appear contradictory to the desired results. For example, from 2008 to 2012 the passing rate in the college-level math courses of those beginning in developmental math dropped from 100% to 88.4% (Table 2R1.29); similarly, English course pass rates dropped from 88.9% to 67.7% (Table 2R1.30). Three significant reasons may account for this discrepancy:
1. Southeast Tech adjusted its required placement scores requiring more students to take pre-academic coursework; therefore, there is now a significantly  larger population of developmental students taking the 101 course, which may skew the results. larger population of developmental students taking the 101 course, which may skew the results.
2. From 2008 to 2011, NCCBP only included those developmental students who took the 101 required course in the data. Starting in 2012, the Southeast Tech students counted in the data included those who took the 099/101 combination in the same semester and those who took 098 and 101 in separate semesters. The success of students in the combination course may be a factor in the lower percent. Furthermore, the results from 2008-2011 may not be comparable to the 2012 results.
3. Finally, Southeast Tech currently has only one data point using the new 099/101 combination (2012). The Institute recognized during this first year of offering the combined coursework that several adjustments were necessary to improve overall results. 
The Institute believes that these changes, as well as the changes described in the Pre-Academic Students section, will have a positive impact on future results.
Online Students (Distance Learners):
When compared to the NCCBP cohort, Southeast Tech’s distance learning pass rates are excellent and improving, moving from a 66.2% rate in 2011 to a 72.8% rate in 2015, an increase of over 6%. The Institute has also moved from the 50th to the 81st percentile pass rate. While the Institute is pleased with these results on the course level, the ultimate goal is to retain students and move them to completion. Therefore, the Institute will continue to develop its online processes to meet student needs and improve retention rates (see Online Students section). ultimate goal is to retain students and move them to completion. Therefore, the Institute will continue to develop its online processes to meet student needs and improve retention rates (see Online Students section).
Student Satisfaction
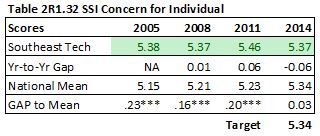
The Noel-Levitz Student Satisfaction Inventory (SSI) conducted every three years is the primary indicator of Southeast Tech’s student satisfaction. Southeast Tech results are very positive, particularly when compared nationally with other two-year institutions. The three key areas of student satisfaction related to key student groups are provided in Tables 2R1.32, 2R1.33 and 2R1.34. Ratings are based on a 7 point rating system with 7 meaning “very satisfied” and 1 meaning “not satisfied at all. The * ** *** all indicate that the difference to the national mean is statistically significant. The Student Success Team has set the target level to be the highest National Mean score registered from the 2005, 2008, 2011, 2014 years. Southeast Tech again surveyed its students in spring 2017; however, results will not be available until July 2017.
Southeast Tech consistently scores high on Concern for the Individual (Table 2R1.32), reaching the highest national mean score every year. Service Excellence (Table 2R1.33) and Student Centeredness (Table 2R1.34) are both consistently within 90% of the target and are statistically at or above the national mean score every year; however, the Institute believes that through its continued focus on its key student groups as indicated throughout 2R1, these student satisfaction scores will reach or surpass the national mean in the future.
Add to Catalog Bookmarks (opens a new window)
|