4R1 Mission and Vision Results
What are the results for developing, communicating and reviewing the institution’s mission, vision and values? These results may include:
- Summary results of measures (include tables and figures when possible)
- Comparison of results with internal targets and external benchmarks
- Interpretation of results and insights gained
Summary Results of Measures AND Comparison of Results with Internal Targets and External Benchmarks AND Interpretation of Results
While KPI are frequently associated with strategic plans, a strategic plan’s emphasis may only be on parts of the KPI. Southeast Tech believes KPI are measures o f mission accomplishment, which is separate from measures of strategic plan deployment. Therefore, the Institute includes KPI in the mission section of the Portfolio. The KPI listed below are also referenced in other sections of the Portfolio with analysis and insights; therefore, for each KPI, an overall statement is provided with references to locations where further information is available. Overall insights into how well Southeast Tech believes it is meeting its mission based on KPI results is provided in the Insights Gained section below. f mission accomplishment, which is separate from measures of strategic plan deployment. Therefore, the Institute includes KPI in the mission section of the Portfolio. The KPI listed below are also referenced in other sections of the Portfolio with analysis and insights; therefore, for each KPI, an overall statement is provided with references to locations where further information is available. Overall insights into how well Southeast Tech believes it is meeting its mission based on KPI results is provided in the Insights Gained section below.
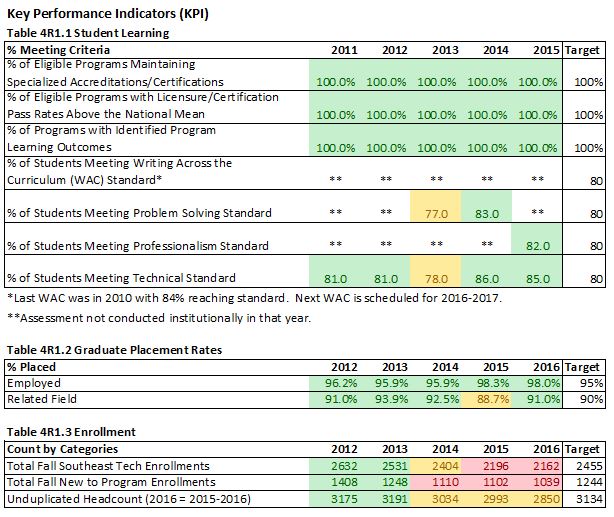
Student Learning is key to the success of the Institute, its students, and the community the Institute serves. If the Institute fails to effectively train its students, the mission cannot be met. Therefore, student learning is the most important measure of meeting the mission. As Table 4R1.1 indicates, the Institute’s student learning accomplishments have been excellent. Programs have maintained their accreditations (Diesel Technology did not in 2016), students have performed higher than national averages on certifications (based on pass rate percentages), and Common Learning Outcomes have been consistently reached or have been within 90% of Institutional targets (See Category 1).
Graduate Placement Rates are at the heart of Southeast Tech meeting its mission. Regardless of how well graduates are trained, the Institute is not serving its community if graduates are not employed. Table 4R1.2 attests to the significant impact Southeast Tech has had on its community and its graduates. With employment rates as high as 98% and in-related field rates above 90%, Southeast Tech is proud of its ability to serve its stakeholders (see Category 1).
In order to meet the graduate workforce needs, Southeast Tech’s Enrollment numbers must reflect the needs of its stakeholders. As shown in Table 4R1.3, Southeast Tech maintained strong enrollment numbers in 2012 and 2013 but has seen significant reductions for the past three years as the economy improved. Not surprisingly, during the recession enrollments increased; however, with the region’s unemployment rate below 3%, Southeast Tech must not only compete with other colleges for students, it must compete with the job market. Recent sector breakfasts with employers, however, reinforced the region’s workforce needs and the Institute’s need to find ways to increase enrollment rates, and by doing so, produce more trained graduates. In 2015-2016, Southeast Tech took on this challenge and implemented new enrollment software to improve student recruitment, and in 2016-2017 Southeast Tech hired a consultant to help the Institute take full advantage of the software as well as improve recruitment processes. While it is still too early for results, the Institute is seeing a significant increase in its accepted student numbers.
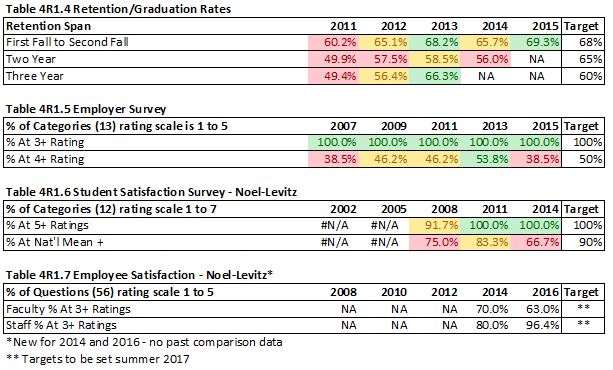
Of course, getting students to the Institute doesn’t mean they will graduate, and fighting the job market in a low unemployment environment is difficult. But as Table 4R1.4 shows, Southeast Tech has been very successful in finding ways to increase its Retention/Graduation Rates, assuring more trained workers will enter the workforce (see Category 2).
The final three KPI are measures of stakeholder satisfaction. Delivering qualified graduates does not automatically assure employer satisfaction. There fore, Southeast Tech surveys employers of our graduates every other year. As shown in Table 4R1.5, the Employer Survey results have been excellent, indicating employer satisfaction in graduate performance. The percentage of the 13 categories rated at the 4+ level (average score on a 5 point Likert scale) fell during the last survey (2015); however, follow-up sector breakfasts over the past year have clarified employer expectations. Employers believe Southeast Tech graduates have strong technical skills, but they would like the Institute to develop more ways to improve graduate soft skills as they relate to job performance. The Institute is therefore implementing more opportunities to provide stronger training in these areas. Overall, however, the results remain strong, and even categories below the 4+ range are very close to that average (Category 1). fore, Southeast Tech surveys employers of our graduates every other year. As shown in Table 4R1.5, the Employer Survey results have been excellent, indicating employer satisfaction in graduate performance. The percentage of the 13 categories rated at the 4+ level (average score on a 5 point Likert scale) fell during the last survey (2015); however, follow-up sector breakfasts over the past year have clarified employer expectations. Employers believe Southeast Tech graduates have strong technical skills, but they would like the Institute to develop more ways to improve graduate soft skills as they relate to job performance. The Institute is therefore implementing more opportunities to provide stronger training in these areas. Overall, however, the results remain strong, and even categories below the 4+ range are very close to that average (Category 1).
Student Satisfaction is vital to retention as well as the Institute’s reputation. Every three years the Institute uses the Noel-Levitz survey to track student satisfaction rates. The number of categories (out of 12) with average scores at the 5+ level (7 point Likert scale) has been at the 100% mark for the past two surveys, moving up from 91.7% in the prior year. While the Institute has not reached its goal of 90% of categories above the national mean, the Institute considers the goal aggressive and long term. New survey results will be available summer 2017 and will help the Institute gauge its current level of satisfaction. The Institute does, however, continue to implement ways to increase student satisfaction (Category 2).
It is often said that Employee Satisfaction is the ultimate driver of success. Paying attention to, and working toward improvement of, employee satisfaction is therefore significant to meeting the Institute’s mission. Prior to 2014, Southeast Tech used its own, internal satisfaction survey. The Institute moved to the Noel-Levitz survey in 2014 to include comparison data. Southeast Tech will wait for one more cycle of the survey (conducted every other year with spring 2018 next in the cycle) before determining an Institutional target. However, as Table 4R1.7 indicates, Southeast Tech has seen a high variation in employee satisfaction between faculty and staff. This has been a topic of discussion and a driver for change since 2014, and the Institute believes it is implementing changes that will address this issue (Category 3).
Southeast Tech believes that Mission Statement Support provides a direct measure of how well the mission statement is understood and accepted by both employers and employees. 
Employers: Southeast Tech uses its employer survey to gauge employer support of the mission. Besides rating the graduate, employers also rate the Institute on various measures. Included in those measures are Meets Company Needs and an Overall Grade. Positive employer ratings on Meets Company Needs assures that the Institute is meeting its mission. From 2007 to 2015, Southeast Tech received overall average ratings of 3.95 or higher on a 5 point Likert scale, and in 2015 the Institute met its target of a 4.00 rating (Table 4R1.8). Over the same timeframe, overall employer grades for the Institute ranged from 91.95% to 92.79% with 2015 receiving the highest percentage (no target has been set for Overall Grade). These ratings indicate employer satisfaction with how the Institute is performing in terms of its mission (2R3). Southeast Tech’s sector breakfast minutes also point to employer satisfaction with the Institute meeting its mission.
Employees: Southeast Tech uses the Noel-Levitz College Employee Satisfaction Survey to gauge employee support of the mission statement, surveying employees on three key elements as shown in Table 4R1.9. The Institute conducts the survey every other year and had its own survey until 2014; therefore, the Institute only has two data points at this time for comparison. The Institute set the highest national mean score of the two survey years (2014 and 2016) as the Institute’s target level. Currently, the Institute is within 90% of the target (yellow) in the three areas of Employees Understand the Mission, Employees Support the Mission and Goals Are Consistent with the Mission. Southeast Tech believes that its upcoming improvements in employee onboarding (3P1) and recent improvements in employee involvement in planning (4P2) will help move these indicators to the target level. Institute conducts the survey every other year and had its own survey until 2014; therefore, the Institute only has two data points at this time for comparison. The Institute set the highest national mean score of the two survey years (2014 and 2016) as the Institute’s target level. Currently, the Institute is within 90% of the target (yellow) in the three areas of Employees Understand the Mission, Employees Support the Mission and Goals Are Consistent with the Mission. Southeast Tech believes that its upcoming improvements in employee onboarding (3P1) and recent improvements in employee involvement in planning (4P2) will help move these indicators to the target level.
Southeast Tech completed its formal review of its mission and vision statements in fall 2017 as part of the Strategic Planning process. The Strategic Planning Committee reviewed and revised the Institute’s mission and vision statements and gave it to the Southeast Tech community for input. The Institute surveyed current employees regarding the new mission and vision statements through an online survey. Seventy-six employees (35+%) completed the survey with 92.11% agreeing with the new mission and vision statements, and another 6.58% agreeing with the new mission and vision statements but requesting modifications. Only 1.32% said they did not support the statement changes. Employee suggestions were sent back to the Strategic Planning Committee for review.
Final mission and vision statements were presented to and approved by the Council and subsequently endorsed by the Board. The new statements went into effect fall 2017. Southeast Tech will now follow its mission, vision and values process as outlined in 4P1.
Add to Catalog Bookmarks (opens a new window)
|